You Have Dashboards but No Decisions: The Difference Between BI and Analysis
Most companies have invested in dashboards. Far fewer can say which decision changed because of one. This post explains what BI is good for, the three questions it cannot answer, and what it takes to get from charts to decisions.
The dashboard nobody acts on
It is Monday morning. The sales dashboard is on the screen. Revenue is down 8% against last month. Someone asks why. Someone else opens a filter, then another. Twenty minutes later there are three theories, no agreement, and an action item to "look into it".
Next Monday the number is different and the meeting starts again.
This is not a failure of the people in the room, and it is not really a failure of the dashboard either. The dashboard is doing its job. It was just never built to do the job the meeting needs.
What BI is for
Business intelligence tools describe. They take data from many systems, define the numbers once, and show everyone the same picture: what was sold, where, to whom, compared with last period.
That is valuable. A company where sales and finance argue about whose revenue figure is right has a problem BI solves well. So does a company that needs to notice quickly when something moves.
But describing is the first step of four. The other three are explaining, predicting and deciding, and a dashboard leaves all three to whoever is looking at it.
Three questions a dashboard cannot answer
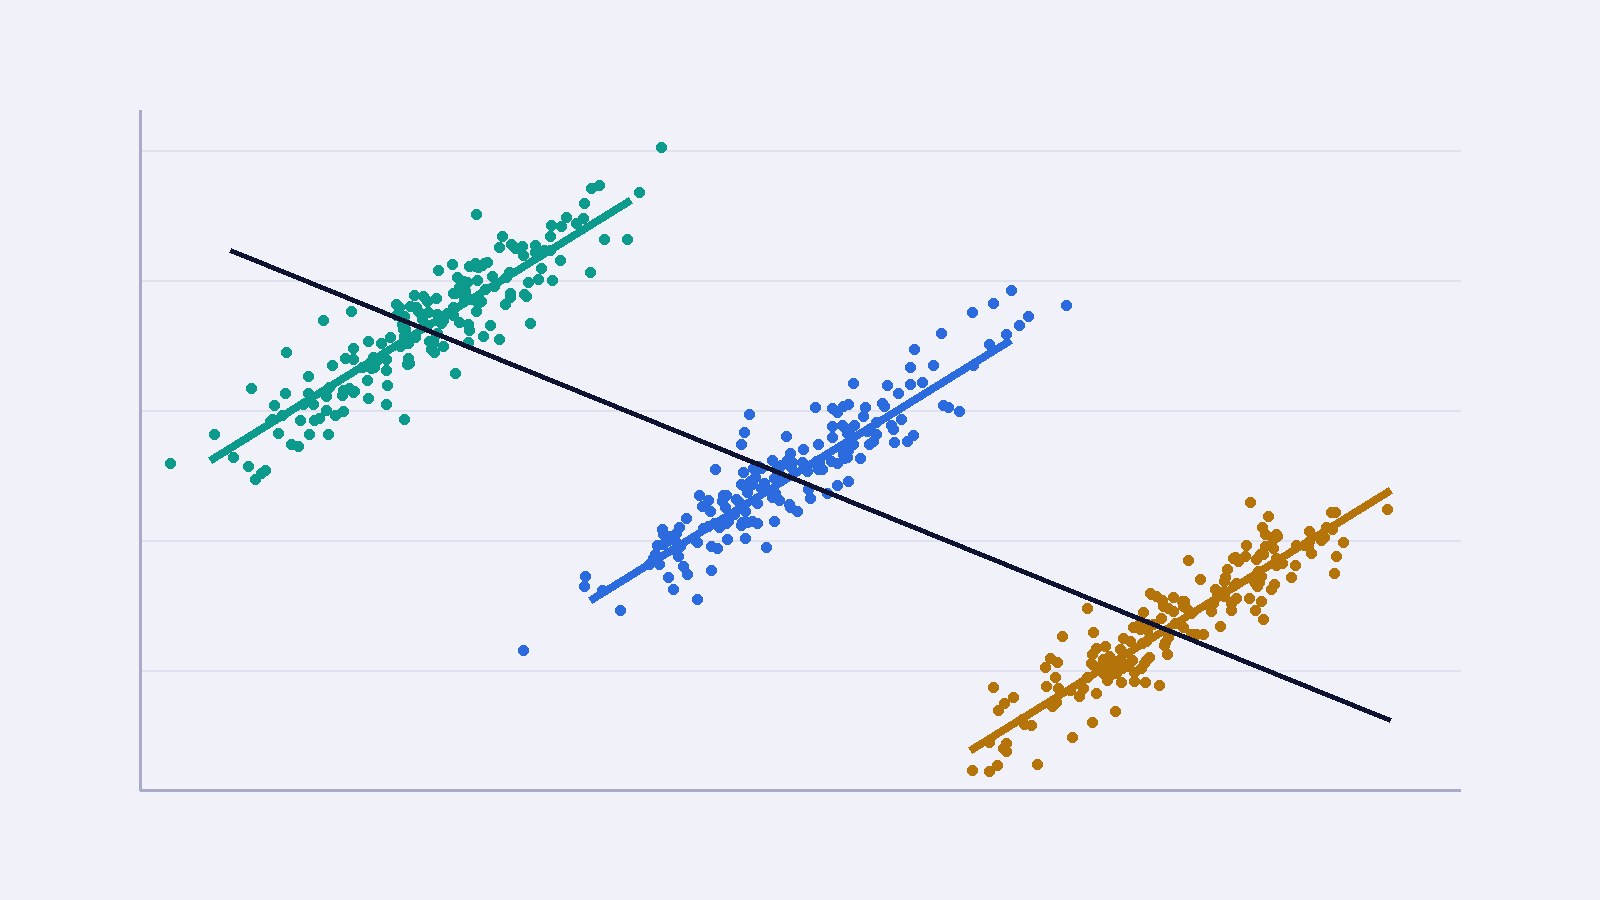
Why did it happen? A dashboard shows that revenue fell. Clicking through regions and products will surface something that also fell, and it is tempting to call that the cause. Often it is just another symptom. Separating the real driver from everything that moved alongside it takes a method, not a filter.
What happens next? A chart of the last twelve months invites the eye to extend the line. That is a forecast made by instinct, with no measure of how wrong it might be. A decision about stock or hiring needs a range, not a guess.
What should we do? Even with a cause and a forecast, the choice remains: where should the next unit of budget go, which accounts should be called first, how much should be ordered. These are optimisation questions with real constraints, and no chart answers them.
Why more dashboards do not help
When a dashboard does not produce decisions, the usual response is to build another one. More filters, more breakdowns, more tabs.
This makes things worse in a specific way. Every additional slice is another comparison, and with enough comparisons something will always look unusual by chance. People are very good at finding patterns, including ones that are not there. A team with forty charts will find a story every week, and most of those stories will not hold up.
The effort also lands on the wrong people. Managers who should be deciding spend their time interpreting.
Dashboard and analysis, side by side
| Dashboard | Analysis | |
|---|---|---|
| Question | What happened? | Why, what next, and what should we do? |
| Output | Charts to interpret | An answer, with how far it can be relied on |
| Who does the thinking | Whoever is looking | The method, checked against reality |
| Handles chance | No: every slice looks meaningful | Yes: separates signal from noise |
| Ends in | A meeting | An action |
Neither replaces the other. BI tells you where to look. Analysis tells you what is true when you get there.
From charts to decisions
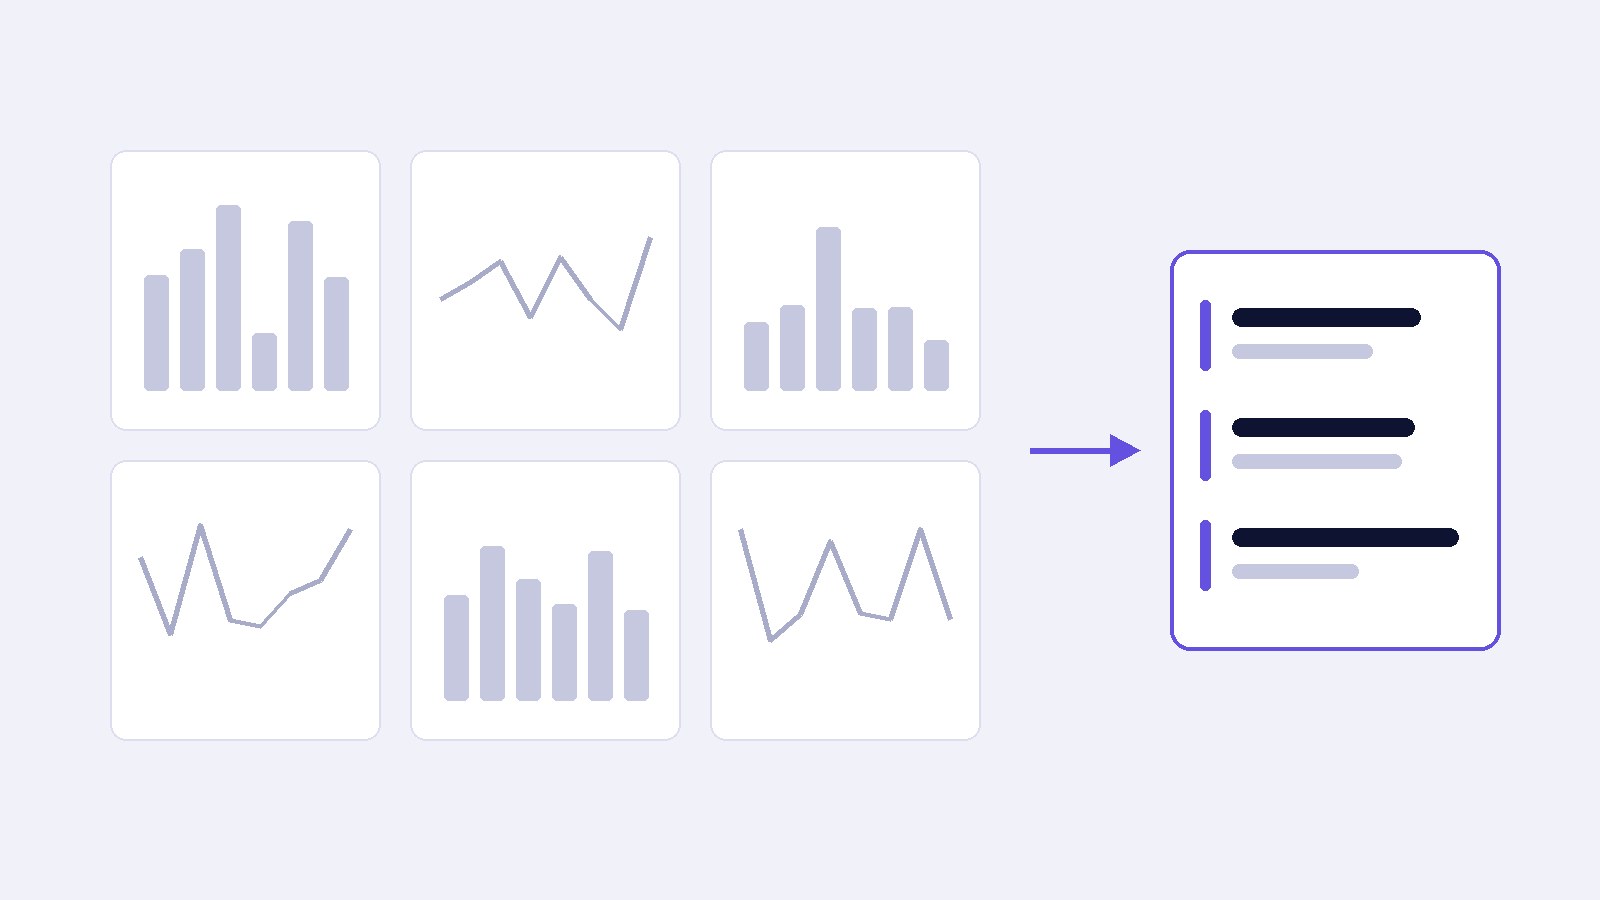
The step most companies are missing is not a better chart. It is a layer between the data and the people that does the explaining, predicting and recommending, and hands over the result.
In practice that looks less like a dashboard and more like a short list:
- These eleven accounts show the pattern that usually comes before a customer leaves. Here is the main reason for each.
- Demand for March is likely to fall between these two numbers.
- Moving this share of the budget from one region to another is expected to return more, within your constraints.
The team does not need to see the model, or even the data. They look at what the system tells them and get on with their work. The dashboards stay, for monitoring. The decisions come from somewhere else.
Where to start
Pick one decision that your company makes repeatedly and that matters: how much to order, whom to call, where to send people, what to discount.
Then ask three questions. What would you need to know to make it well? Does any dashboard you have tell you that, or does someone work it out by hand each time? And how would you know afterwards whether the decision was right?
The gap between what you need to know and what your dashboards show is the project. It is usually smaller and more specific than "become data-driven", which is why it tends to work.
Final thoughts
Dashboards made data visible. That was a real step, and it is finished. The next one is making data do something: turning it into answers and actions without asking every manager to become an analyst.
If you have a decision that your dashboards describe but do not help you make, see how we work or tell us about it.
See it on your own data
Tell us about your team and we'll show you what this would look like for you.
Book a Demo